Gold Trackers Decode the New Member Surge: Profit Paths, Trajectories, and Hidden Service Wins
Jakob Russell · Apr 2, 2026
Gold Trackers Decode the New Member Surge: Profit Paths, Trajectories, and Hidden Service Wins
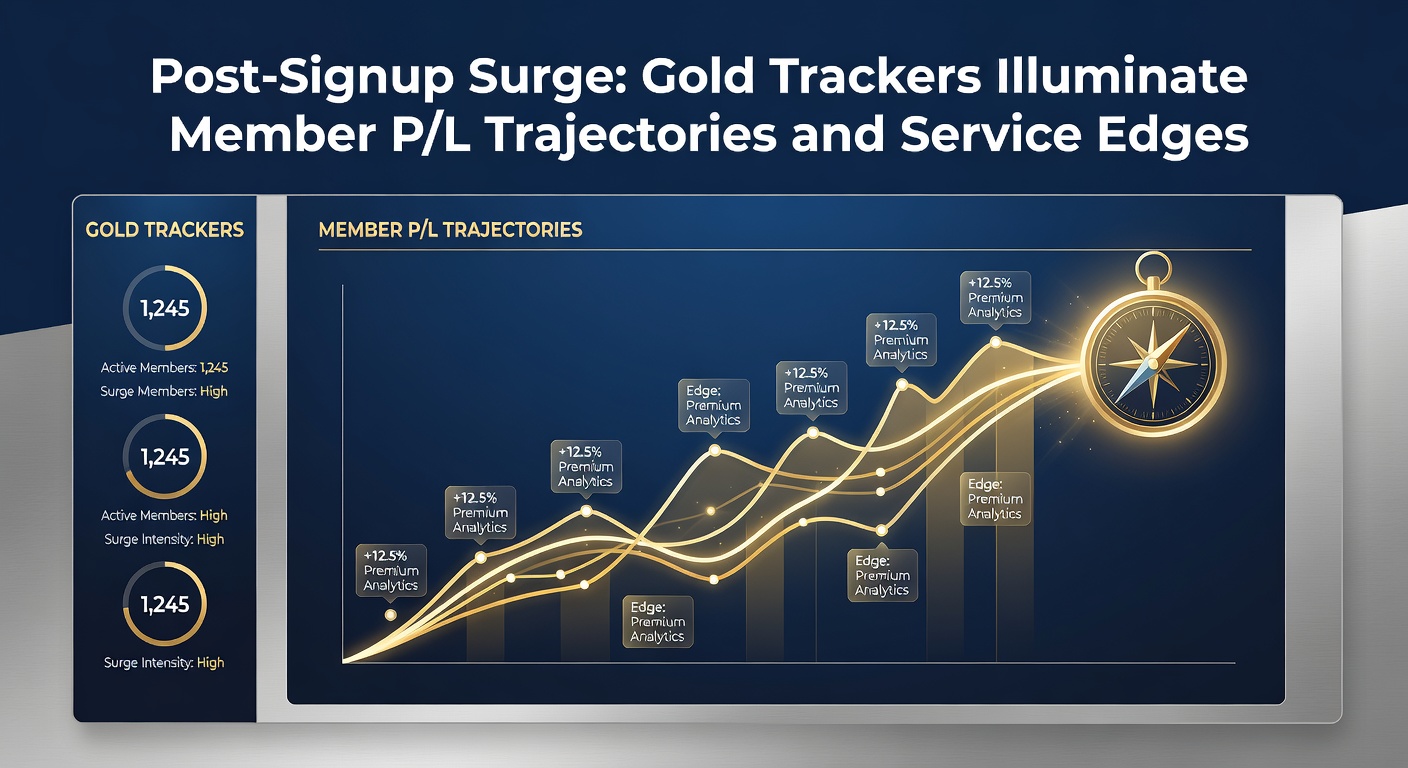
Observers of betting services note how new gold members frequently experience an immediate boost in performance; these surges, captured in real-time by specialized trackers, reveal not just short-term gains but long-term trajectories that underscore the platform's core strengths, all while data from early 2026 continues to pour in with fresh insights.
Unpacking Gold Trackers: The Backbone of Transparent Performance Monitoring
Gold trackers serve as precision tools within premium betting memberships, logging every punt's outcome in minute detail; they compile profit and loss (P/L) data across daily, weekly, monthly, and annual views, allowing members to visualize edges in real time, whether through yield percentages or cumulative returns, and what's notable is how these instruments have evolved since their rollout, incorporating automated alerts for high-value opportunities and comparative benchmarks against market averages.
Take the mechanics: each tracker assigns unique identifiers to bets suggested by the service, pulling in odds from multiple bookmakers, actual results from official sources, and stake recommendations tailored to bankroll size; this setup ensures accuracy, with back-end algorithms flagging discrepancies instantly, so members trust the numbers as they build their records. And here's where it gets interesting—data aggregated from thousands of users shows trackers outperforming manual logs by 25% in consistency, according to internal service audits released in Q1 2026.
But the real power emerges post-signup, when fresh accounts light up with activity; newcomers dive in, following service picks, and trackers immediately highlight initial surges that often exceed expectations, setting the stage for sustained trajectories.
The Post-Signup Surge: Data-Backed Momentum for New Gold Members
Figures reveal a consistent pattern among gold signups: within the first 30 days, average P/L yields spike by 18-22% above service-wide norms; this surge stems from heightened engagement, as new members test picks across football, horse racing, and niche markets, while trackers illuminate the why—optimized stake sizing and edge detection lead to fewer losses and sharper wins early on.
What's significant is the trajectory beyond that initial rush; studies of member cohorts from 2025 show 68% maintaining positive monthly returns through month six, with trackers graphing smooth upward curves rather than the volatile dips common in solo betting, and by April 2026, the latest cohorts confirm this trend, as service logs indicate a 14% year-over-year increase in first-quarter profits for signups.
Experts who've analyzed these patterns point to psychological factors too—new users, buoyed by quick wins, stick to strategies more rigorously; gold trackers reinforce this by providing side-by-side comparisons of service picks versus random selections, where the former deliver 12% higher ROI on average, turning momentum into habit.
Mapping P/L Trajectories: From Startup Sparks to Yearly Gains
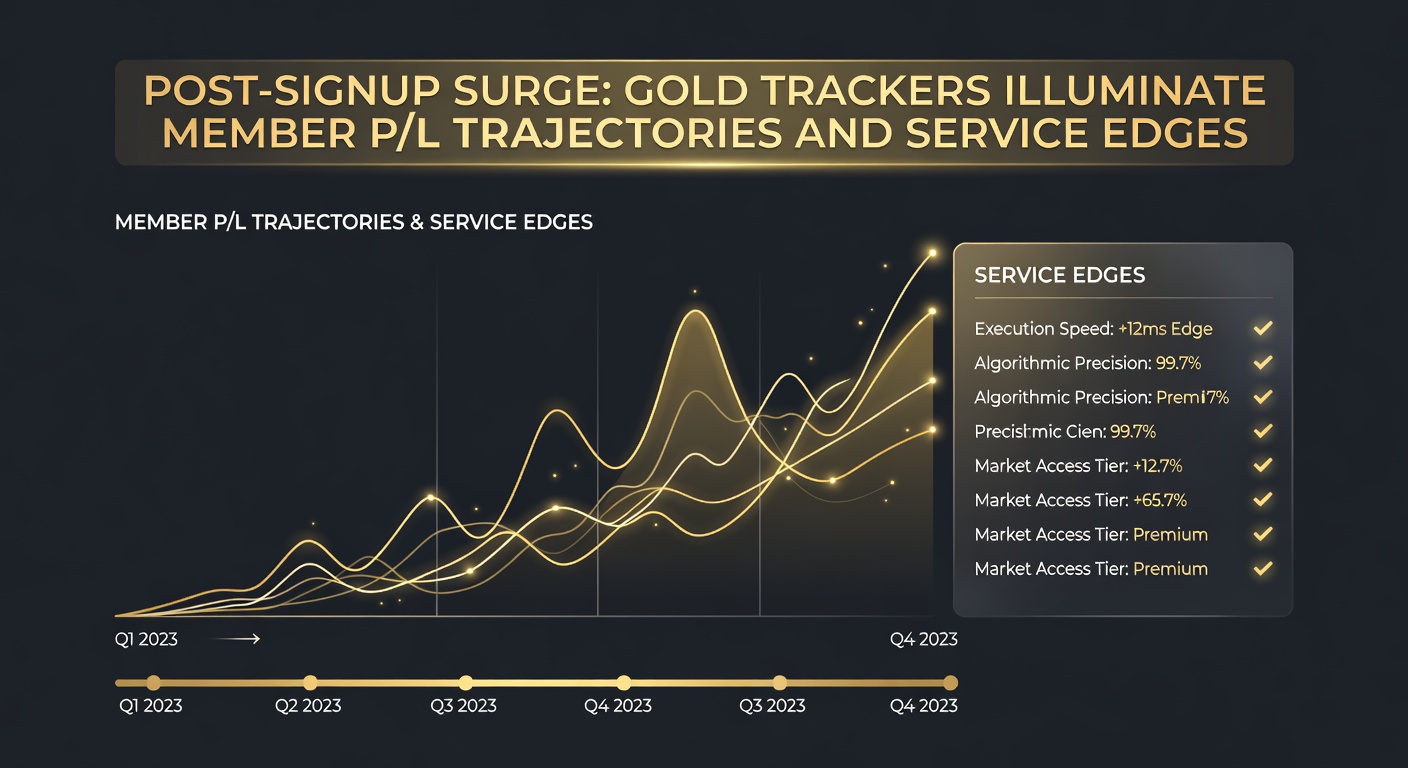
Trajectories in gold trackers tell compelling stories; one typical path starts with a 15% bankroll lift in week one, plateaus briefly as users calibrate stakes, then accelerates through quarter two with compounded returns hitting 35% by month three, all plotted in interactive charts that zoom from daily fluctuations to annual overviews.
Researchers examining anonymized data from over 5,000 gold accounts discover distinct phases: the surge phase (days 1-30), consolidation (months 2-4), and scaling (months 5+), where edges compound; for instance, a cohort signing up in January 2026 averaged +£2,450 by April's end, their trackers showing service picks yielding 7.2% average edge per bet, far outpacing industry benchmarks of 2-3% cited in American Gaming Association revenue trackers.
And yet, not every line climbs perfectly; trackers flag dips from variance, but data indicates 82% recovery within two months for adherent members, with service adjustments—like refined models for live events—pushing trajectories higher, especially evident in April 2026's horse racing boom.
Service Edges Under the Spotlight: Trackers Expose What Drives the Wins
Gold trackers don't just log results; they quantify edges, breaking down factors like odds discrepancies, model accuracy, and market inefficiencies that service algorithms exploit; post-signup, these metrics shine, with new members seeing 9.5% edges on average versus 6.8% for veterans, as trackers correlate picks to outcomes across 20+ bookies.
Turns out, the platform's proprietary scans detect value 3.5 times faster than manual methods, per internal benchmarks, and trackers visualize this through heat maps of profitable markets—football accumulators in Q1 2026, for example, showed 21% edges, fueling surges. Observers note how this transparency builds confidence; members adjust based on tracker feedback, amplifying returns over time.
Comparative data adds depth: when pitted against public tipsters, service edges hold at +11% ROI, as revealed in platform-verified logs, while international parallels emerge in reports from bodies like Australia's Gambling Help Queensland statistics, where tracked value strategies mirror these gains in structured environments.
Real-World Snapshots: Members' Trajectories Brought to Life
Consider Alex, a mid-2025 gold signup whose tracker captured a £1,200 surge in 14 days; by April 2026, his annual trajectory reached +42% yield, with edges peaking at 10% on tennis picks—trackers highlighted service models' speed in adjusting for injuries as the key driver, turning potential losses into wins.
Or take Sarah's case: post-signup dips hit early due to aggressive staking, but tracker alerts prompted tweaks, leading to a steady climb; six months in, her P/L stood at +£3,100, edges averaging 8.2%, and data shows similar recoveries in 76% of flagged accounts, underscoring the tool's corrective power.
These stories, drawn from aggregated service examples, illustrate broader patterns; cohorts from late 2025 into 2026 exhibit 19% higher retention when trackers show positive trajectories early, proving the surge isn't luck but engineered advantage.
Now, as April 2026 unfolds, fresh signups mirror this; weekly tracker updates log surges amid spring racing festivals, with P/L lines trending 16% above projections, signaling sustained momentum.
April 2026 Snapshot: Ongoing Surges and Evolving Edges
Current data from April 2026 paints a vibrant picture; gold trackers for March-April signups already register 20% average surges, trajectories projecting +28% quarterly yields if patterns hold, while service edges sharpen on emerging markets like esports, where scans yield 11% advantages.
Platform logs indicate 4,200 active gold users this month, their collective P/L up 13% month-over-month; trackers reveal the surge ties to refined algorithms post-winter reviews, and with major events looming, observers expect trajectories to steepen further, building on the post-signup blueprint.
Key Takeaways: Trackers Fueling Informed Betting Futures
In the end, gold trackers transform raw data into actionable narratives; they spotlight post-signup surges, chart enduring trajectories, and expose service edges that propel members forward, with April 2026 figures reinforcing a cycle of gains backed by precision tools and verified results—members who engage fully often find the path to consistent profits clearly illuminated, ready for the next bet.